lOOkkle
SEO Site Explorer
Lookkle's SEO Site Explorer is an advanced tool designed to provide detailed information on various SEO and web traffic metrics, such as:
- Analysis of a website's current and historical visitors.
- Analysis of potential errors in a website's design.
- The website's different rankings in Google based on search terms.
- The top pages that reference the site and their statistics.
- Top visitors to a website by demographics and by device: mobile, desktop, or tablet.
- Other extremely important data if you want to gain in-depth insight into all the statistics that help a website rank well in the major search engines.
- Potential errors that indicate a site's failure if it fails to rank high in any search engine.
By improving any website's potential errors using lOOkkle's SEO Site Explorer tool, you can improve your rankings on major search engines like Google, Bing, and Yandex. You can also improve your user experience, so they don't abandon your site quickly due to a poor experience.
Web Traffic Analysis
One of the main functions of SEO Site Explorer is web traffic analysis.
It displays a detailed breakdown of the following statistical data about the analyzed website
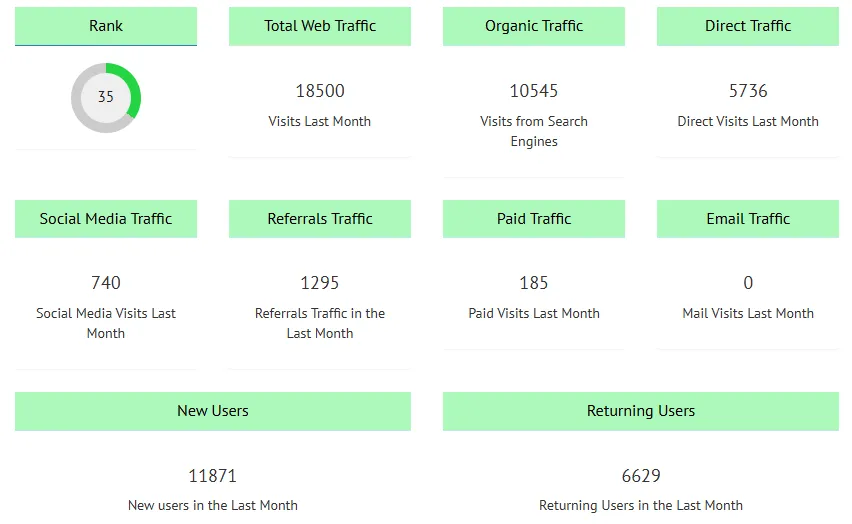
Website Ranking (0-100)
Website Ranking calculated based on web traffic and the positions of the website's pages in major search engines such as Google, Bing, or Yandex. Its values range from 0 to 100, with the highest score being 100.
It's a composite metric that calculates a website's ranking based on:
- Its total traffic.
- The authority of its pages in search engines like Google, Bing, or Yandex.
- Ranked keywords and backlinks.
What does the number mean?
- It ranges from 0 to 100.
- The closer it is to 100, the greater the site's visibility and authority.
- Sites like Amazon, YouTube, or Wikipedia are often close to 100.
Total Web Traffic
Total visits the website received in the last month.
Why is it important?
It's the starting point for analyzing the site's health. But having a lot of visits isn't enough: where those users come from and how they behave also matters.
Organic Traffic
Total visits from search engines that a website received in the last month (Google, Bing, etc.).
These are users who searched for something and arrived without clicking on ads.
Valuable and stable traffic if you do good SEO.
Direct Traffic
Total direct visits or visits in which a user directly accessed a website in the last month.
Shows loyalty or prior brand awareness.
Also includes traffic that cannot be attributed (sometimes from apps or untagged links).
Social Media Traffic
Total visits from social networks that a website received in the last month like Facebook, Instagram, X, LinkedIn, or Pinterest.
Ideal for capturing quick or viral traffic, but less stable than organic traffic.
Referral Traffic
Total visits from other websites that a website received in the last month (blogs, media, forums).
Helps with SEO and shows that others are recommending you.
Paid Traffic
Total visits from advertising campaigns using different payment methods that a website receives in the last month (Google Ads, Meta Ads, etc.).
It offers quick results, but depends on your investment.
Email Traffic
Total visits from newsletters or email marketing campaigns that a website receives in the last month.
It can have high conversion rates if you segment well.
New Users
Total visits from new users who discovered a website for the first time in the last month (based on cookies).
A good indicator of reach and engagement.
Returning Users
Total visits from users who frequently return to the website in the last month. Users who have previously visited your site.
They show loyalty and real interest in your content or brand.
How to use them strategically?
Improve organic traffic → invest in content, SEO, and keywords.
Increase direct traffic → build your brand and gain loyal followers.
Combine channels → social, email, and paid channels should complement your strategy.
Monitor new vs. returning users → if no one returns, something is wrong.
Boost your Website Ranking → by improving all of the above points.
How These Web Metrics Are Related
| Metric | What It Indicates |
|---|---|
| Website Ranking | Overall authority and visibility, based on search engine rankings and traffic performance. |
| Total Traffic | Total reach and volume of visitors across all sources. |
| Organic Traffic | Effectiveness of SEO and keyword positioning in search engines. |
| Direct Traffic | Brand awareness and loyalty; users type your URL or have it bookmarked. |
| Referral Traffic | Authority and exposure through external websites linking to your content. |
| Social Media Traffic | Engagement and visibility via social networks and viral reach. |
| Paid Traffic | Performance of your advertising campaigns (Google Ads, Meta Ads, etc.). |
| Email Traffic | Efficiency of email marketing campaigns and list segmentation. |
| New Users | How well you're attracting new audiences and growing your reach. |
| Returning Users | User retention and repeat visits, a sign of user satisfaction and interest. |
Countries Traffic Insights
This feature allows you to analyze the distribution of total traffic by country, facilitating targeted marketing strategies.
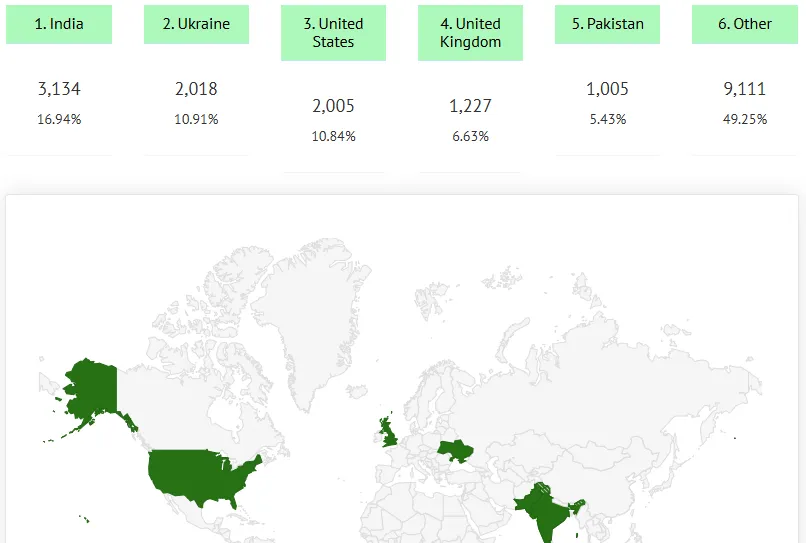
What do they allow you to analyze?
1. Where is your current audience?
Example: If 60% of your traffic comes from Mexico and you were thinking of targeting Spain, you need to adapt your strategy.
2. Expansion opportunities:
If you see that you are gaining visitors from a country you weren't focusing on, you could:
- Translate content
- Use local SEO
- Create targeted advertising campaigns
3. Technical or design adjustments:
- Users from different countries:
- Use different devices (mobile, PC)
- Have different internet speeds
- Prefer other payment methods or social media
User Engagement Metrics
Engagement is a key factor for in-depth website analysis.
The SEO Site Explorer tool measures bounce rates, average session duration, and user interaction to determine the effectiveness of your content.
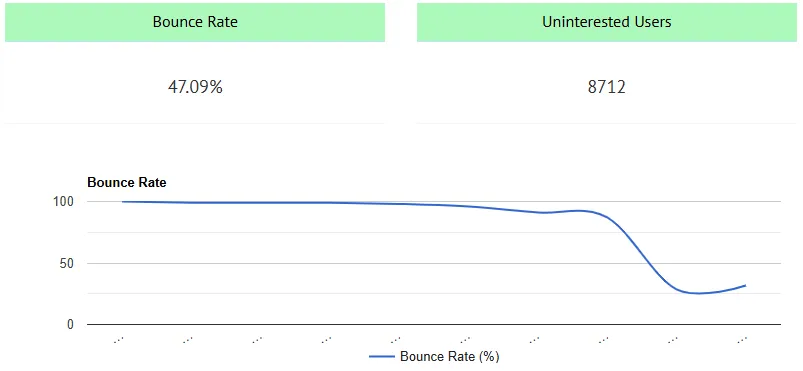
Bounce Rate
This is the percentage of users who visit a page and leave without interacting with the site (i.e., without clicking, navigating to another page, or taking any action).
Example:
If 100 people visit a page and 70 leave without taking any action, the bounce rate is 70%.
Is it bad?
Not always. It depends on the type of content:
- In an informational blog: it may be normal for the user to find the answer and leave.
- In an online store: a high bounce rate may be a sign of a problem (bad experience, irrelevant content, or slow loading).
Disengaged Users
These are users who arrive at your website but don't find what they're looking for, don't connect with the content, or aren't motivated to stay or interact.
How to identify them?
- High bounce rate.
- Short time on the website.
- Zero conversions.
- Many same-page abandonment.
Common causes:
- Irrelevant content.
- Misleading title (clickbait).
- Poor user experience (design, speed, usability).
- Untargeted traffic (attracting the wrong people).
Time on Website
It's the average time a visitor spends browsing your website.
Why is it important?
The more time they spend, the more they interact. It's generally related to:
- Good user experience.
- Relevant content.
- Smooth navigation.
Practical example:
- A user reads a blog post in its entirety (3-5 minutes).
- They then explore another related article.
- This represents a significant amount of time spent on your site and can improve your Google rankings.
Pages per Visit
The average number of pages a user visits during a single session on your site.
Example:
If 10 users visit 50 pages in total, your average is 5 pages per visit.
Why is it important?
The higher the number:
- The greater the user's interest.
- The better your internal structure (links, navigation, calls to action) is working.
A low value may indicate:
- Irrelevant or unattractive content.
- Navigation or user experience issues.
- Uninterested users (those who bounce).
Relationship between Bounce Rate, Pages per Visit, Time on Site
- High Bounce Rate + Low Pages per Visit + Low Time on Site
Your content isn't engaging or the traffic isn't adequate. Perhaps the title promises more than it delivers. - Low Bounce Rate + High Time on Site + High Pages per Visit
You're achieving a good experience: interesting content and clear navigation. - Uninterested Users = Result of the 3 previous indicators combined incorrectly
These are users who don't find value, and you'll see this reflected in all of this data.
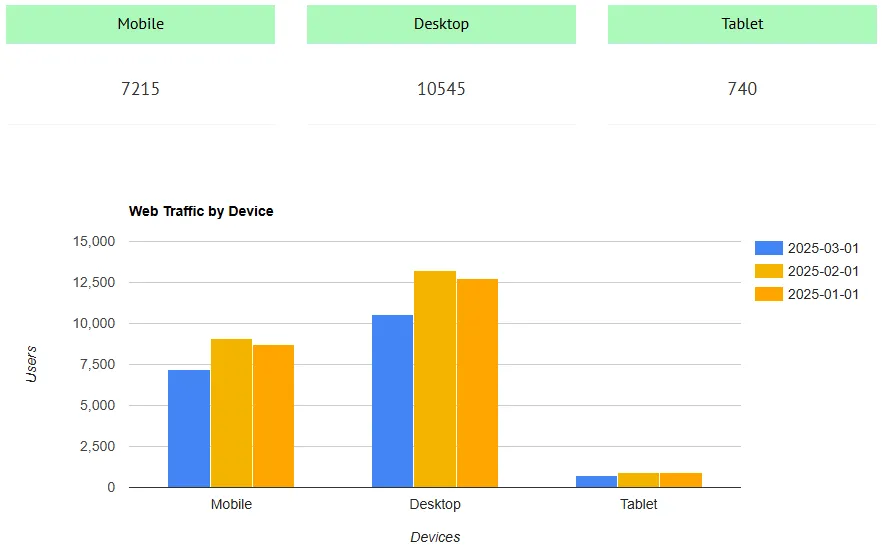
Web Traffic by Device
Web traffic by device refers to the percentage and number of users who access a website from different types of devices, usually categorized as:
-
Mobile (smartphones)
-
Tablet
-
Desktop (laptops or desktop computers)
Why Is It Important?
1. Design & Usability
-
If most visitors come from mobile, your site must be mobile-first.
-
Are your menus, buttons, forms, and images optimized for small screens?
2. Loading Speed
-
Mobile users often have slower internet connections.
-
You should use optimized image formats such as WebP, lazy loading, and lightweight scripts on your website.
3. User Behavior
-
On mobile, users tend to have shorter sessions and visit fewer pages.
-
On desktop, they browse longer and are more likely to complete complex tasks (like purchases or form submissions).
Typical Device Traffic Breakdown
| Device | % of Traffic | Bounce Rate | Avg. Time on Site | Pages/Session |
|---|---|---|---|---|
| Mobile | 65% | 58% | 1:45 min | 2.1 |
| Desktop | 30% | 35% | 3:10 min | 4.4 |
| Tablet | 5% | 45% | 2:30 min | 3.0 |
What Can You Do with This Data?
-
Adjust your web design: ensure your layout and elements work perfectly on mobile.
-
Segment your ad campaigns: target by device on Google Ads, Meta Ads, or email marketing.
-
Optimize for mobile performance: implement AMP, reduce scripts, and speed up load times.
-
Adapt your content: use shorter headlines, larger buttons, and simplified forms for mobile users.
Web Traffic by Demographic
Web traffic by demographic refers to breaking down your audience based on personal characteristics, such as:
-
Age
-
Gender
-
Location
-
Language
-
Interests
-
Device preferences
-
Income level
This data helps you understand who your users really are, beyond just traffic numbers.
Why Demographics Matter
Understanding demographics allows you to:
1. Target the Right Audience
If most visitors are aged 25–34, your tone, visuals, and references should reflect that.
2. Personalize Content
-
Gender: For example, a fashion blog might show different collections based on user trends.
-
Interests: Serve up content that matches hobbies or industries (tech, travel, finance).
3. Optimize Ad Campaigns
Platforms like Google Ads and Facebook Ads let you target by age, gender, interests, and location.
4. Adapt Your Product/Service
Maybe you think your product is for professionals, but the data shows college students love it more , that changes your entire approach.
Example: Traffic by Age Group
| Age Group | % of Traffic | Avg. Session Duration | Bounce Rate |
|---|---|---|---|
| 18–34 | 50% | 3:00 min | 35% |
| 35–54 | 35% | 2:20 min | 40% |
| 55+ | 15% | 1:15 min | 65% |
Tips for Using Demographic Data
-
🔎 Create user personas based on real data
-
📝 Write content that speaks their language (literally and culturally)
-
🎨 Use design and visuals that appeal to their taste
-
📍 Localize content if you see clusters of users in specific countries
-
💬 Test different CTAs (call to action) based on age or interests
Web Traffic History
Web traffic history records how visits to a website change over time from the website's creation date.
It allows you to analyze month by month:
- Total web traffic.
- Organic traffic.
- Estimated total daily visits based on total web traffic.
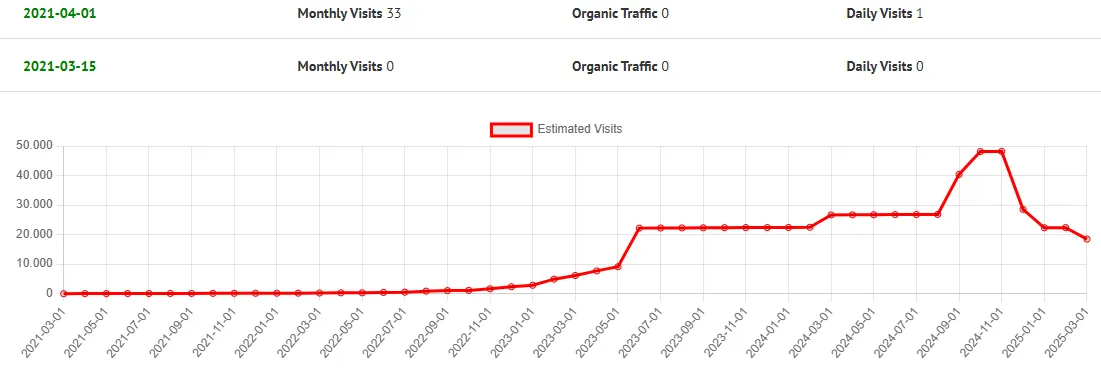
Whether you're doing SEO, content marketing, or paid ads, tracking traffic history helps answer the big question:
💬 “Are we improving over time?”
Why Is Web Traffic History Important?
1. Track Progress
You can compare:
-
Last month vs. this month
-
This year vs. last year
-
Before and after major changes (site redesign, new content, etc.)
2. Understand Seasonality
Some industries have high/low seasons:
-
Retail spikes in December
-
Travel surges in summer
-
B2B tends to slow down in holidays
Seeing those patterns helps plan content and campaigns ahead.
3. Measure Campaign Impact
Launched a new blog post? Ran Facebook Ads?
You’ll see clear spikes (or dips) in your history.
4. Benchmark Against Competitors
Using tools like Similarweb, you can compare your historical traffic against competing websites.
Sample Traffic History Table
| Month | Visitors | Organic Traffic | Paid Traffic | Avg. Time on Site |
|---|---|---|---|---|
| Jan 2024 | 10,000 | 7,000 | 1,000 | 2:10 min |
| Feb 2024 | 12,500 | 8,200 | 2,000 | 2:45 min |
| Mar 2024 | 14,000 | 9,500 | 3,000 | 3:00 min |
| Apr 2024 | 13,200 | 8,800 | 2,400 | 2:50 min |
How to Use It Effectively
-
📅 Create monthly traffic reports (you can automate them)
-
📉 Mark key events on your timeline (content launches, SEO changes)
-
🔁 Compare periods to find patterns or performance gaps
-
📈 Set goals based on real trends, not guesses
Organic Keywords
Organic keywords are words or phrases that users type into search engines (like Google or Bing) and that drive traffic to your website for free, meaning they don't pay for clicks (no ads).
Example:
If you have an article about Instagram marketing and someone searches for "how to grow Instagram followers" and clicks on your result, that phrase is an organic keyword for your site.
Why are Organic Keywords important?
- They show you which content ranks best.
- They reveal your audience's search intent.
- They help you create new, related content.
- They help you optimize your SEO (meta tags, headings, etc.).
Keyword Statistics
These are the key metrics that accompany each keyword and tell you whether it's worth focusing on.
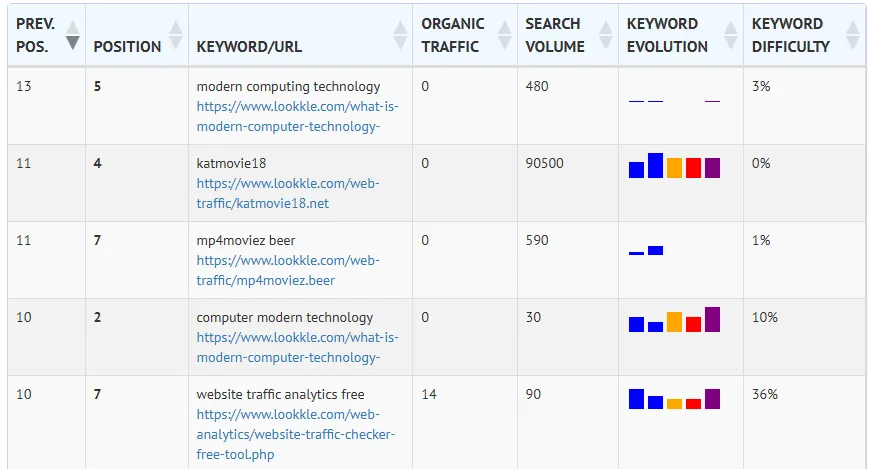
Each keyword a website ranks for in Google has the following statistics:
| Metric | What it indicates |
|---|---|
| Previous Position | Previous position on Google for this keyword before the last update |
| Position | Position on Google for this keyword at the last update |
| Keyword/URL | Keyword and URL currently ranking on Google |
| Organic Traffic | Visits that website is receiving for that keyword on Google in the last month |
| Search Volume | Total number of times that keyword has been searched in the last month |
| Keyword Evolution | Evolution of that keyword based on the number of searches over the last 5 months |
| Keyword Difficulty | Percentage of difficulty in ranking that keyword in the top 10. A higher percentage indicates greater difficulty |
Top Pages
Shows the most visited pages on your website based on the organic traffic each receives.
What can you discover?
- What type of content is most engaging.
- What topics and keywords generate the most traffic.
- Which pages have the best engagement (read time, lowest bounce rate).
- Opportunities to update or expand successful content.
Backlinks
Backlinks (also called inbound links or incoming links) are hyperlinks from one website to another. They are like digital votes of confidence and are very useful for search engines, since the greater the number of backlinks from sites highly trusted by search engines, the better the website's ranking will be.
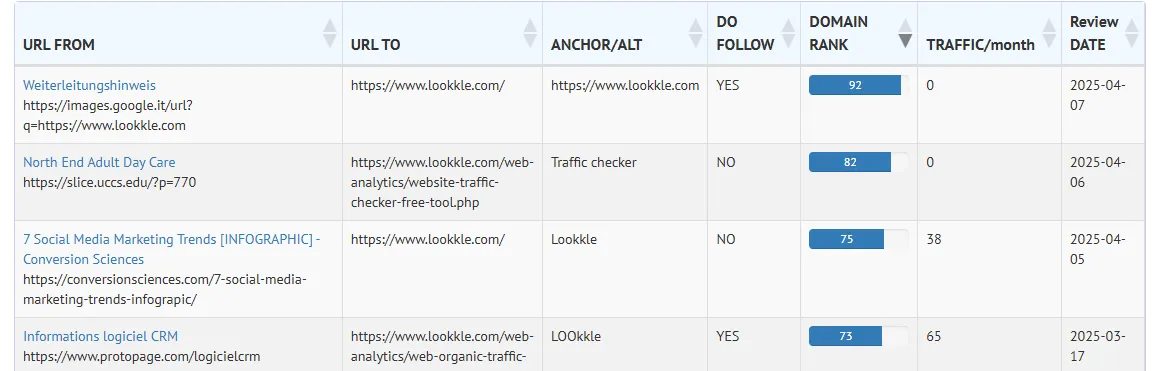
The more quality backlinks you have, the more search engines like Google trust your website.
For example:
If Forbes.com links to your article about digital marketing, that's a high-authority backlink, and a big SEO win.
Backlinks by Domains
This metric shows how many unique websites (domains) are linking to your site.
-
More domains = more trust
-
100 links from 1 website = 🟡 moderate impact
-
100 links from 100 websites = 🟢 much stronger SEO signal
Backlinks to Exact URL
This tells you which specific pages on your site are being linked to the most.
-
Example:
If your blog post/guide-to-seo-toolsgets 150 backlinks, it may be your top-performing page in SEO. -
You can use this insight to:
-
Update and optimize that page
-
Create similar content
-
Internally link to other pages to spread SEO value
-
Backlink Statistics
Some key stats include:
| Metric | What It Means |
|---|---|
| Total Backlinks | Total number of external links pointing to your site |
| Referring Domains | Number of unique domains linking to you |
| From Home Page | A backlink from there conveys more SEO value |
| Anchor Text | The text used in the link, important for keyword context |
| Follow vs No-Follow | Whether search engines pass value through the link |
| Top TLDs | Some domains like .edu, .gov are very authoritative |
Latest Backlinks Added
This tracks the most recent backlinks that have been discovered pointing to your website.
-
Helps you:
- Monitor recent results
- Detect sudden drops or surges
- Spot toxic or suspicious links early
Top Linking Domains
This shows which external websites link to you the most.
-
Are they reputable (e.g. news, edu, gov)?
-
Are they niche-relevant?
-
Are there any spammy or low-quality domains?
Competitor Pages
A website's competitor analysis is based on key data such as web traffic and rankings.
This is an excellent strategy for understanding the performance of competing websites.
How to Analyze and Leverage Competitor Website Data
1. Compare Your Traffic to Your Competitors:
Compare your competitors' new and returning users with those of your own site. If you have fewer new users, you could review your SEO strategy or create more engaging content.
2. Analyze Bounce Rate:
If your competitors have a low bounce rate, but you have a high one, you may need to improve the user experience (UX) or make your content more relevant to your visitors.
3. Strengthen Your Social Media Presence:
If your competitors' social media traffic is strong, but yours is low, you should evaluate your social strategy. Consider running social media campaigns to attract more traffic.
4. Backlinks and Referrals:
If your competitor's referral traffic is low, but their search engine traffic is high, they're likely working on good SEO. Take advantage of this and work on your own backlink strategy.
5. Optimize Dwell Time:
If your competitors have a good time on the site and you don't, review the quality of your content and site structure. Is it easy to navigate? Are you providing value to your users?
On-Page SEO analysis
An On-Page SEO analysis is a crucial part of a search engine optimization (SEO) strategy.
It refers to the evaluation and improvement of all the elements that make up a website and affect its visibility and performance in search engines.
Some of the main components, among the myriad of elements, analyzed by the On-Page SEO tool performed by Lookkle's SEO Site Explorer tool are the following:
- Page Title
- Meta Description
- Headings (H1, H2, H3, etc.)
- Content such as text, images, videos, and other information contained on the page.
- Keyword Optimization
- Image Optimization
- Friendly URLs
- Loading Speed
- Internal Links
This tool will display errors according to their importance and On-Page SEO Ranking in the main section, followed by a more detailed analysis.